Options Trading 101: Options Explained in Plain English
An introduction to stock options trading for beginners.


Stock options are just like coupons. And if you know how to use a coupon, you’ll know how trading stock options work.
Stock Options 101: How Options Work
To explain how options work, let’s start with looking at something you’re already familiar with - a coupon.
Take this one for example - get ten-piece nuggets for $1.99 before March 15, 2020.

Although coupons are free, options are not. You have to buy them. I’ll cover more on this later so for now, just assume you bought this coupon for $0.50.
Now with this coupon, you have the choice to buy ten-piece nuggets at a guaranteed price of $1.99 before March 15th, but you don’t have to use it if you don’t want to. You have the option to, but not the obligation. This coupon has essentially the same makeup as a stock option:
- The ten-piece nuggets are the underlying asset, the thing which you have an option to buy
- $1.99 is what’s called the strike price, the price you and the seller struck a deal on
- March 15, 2020 is the expiration date, the last day you have the option available to use it
- The $0.50 you paid for the coupon is called the premium
An investor would buy this coupon if they think the price of chicken will go up before the expiration date so they can buy ten-piece nuggets at a guaranteed price of $1.99.
Let’s say there’s been a global chicken shortage and now the cost for ten-piece nuggets went up from $1.99 ($2 for simplicity’s sake) to $6. Now the investor can exercise their option to use the coupon and buy ten-piece nuggets for the $2 price and resell them on the open market for $6. After factoring in the premium paid of the coupon ($0.50), the investor profited $3.50.
What if instead veganism has taken over and now ten-piece nuggets only cost $1? Since the investor could now buy ten-piece nuggets for $1 on the open market, they have no reason to use the coupon to buy them for $2. This makes the coupon worthless. In this scenario, the investor wouldn’t exercise their option to use the coupon and their loss is only the $0.50 premium they paid for the coupon.
Options, at their core, are really this simple. Although they can get more complex when it comes to buying, selling, and using them in various investment strategies, they aren’t impossible to understand. Let’s leave behind the coupon analogy and now look at the two different types of option contracts and their makeup.
What is an Options Contract?
An options contract is an agreement that gives the purchaser an option to buy or sell a stock at a later date at a predetermined price. The agreement is always between two parties, a buyer (a.k.a. the holder or owner) and a seller (a.k.a. the writer).
The expiration date is when the option expires. When you’re the buyer, you can exercise an option on or before the expiration date. When you’re the seller, you can be assigned to fulfill your obligation of the contract on or before the expiration date.
There are only two main types of option contracts, call options and put options.
Call options, or “calls” for short, give the buyer the right to call the underlying asset away from the option seller and buy it at a predetermined price up to a predetermined date. An investor purchases a call option contract when they think the price of the underlying asset will increase in value beyond the agreed upon strike price before the expiration date.
Put options, or “puts” for short, give the buyer the right to put the underlying asset up for sale and sell it to the option seller at a predetermined price up to a predetermined date. An investor purchases a put option contract when they think the price of the underlying asset will decrease in value beyond the the agreed upon strike price before the expiration date.
Both call and put options are contracts that give the buyer the right to buy or sell the underlying asset, and not the obligation to do so. Therefore, the seller of the contract is giving up their right and control. So what’s in it for the seller? Since the option contract has value, the buyer has to pay the seller for it. This payment is called the premium. The price for the underlying asset that the two parties agreed upon is called the strike price because that’s the price they “struck” a deal on.
Ways to exit an options trade
If the underlying asset’s value moves in favor of the option buyer before the expiration date, they can sell the option contract itself to another buyer at a higher premium for a profit. At expiration, if the price of the underlying asset has moved beyond the strike price (this is called in the money), they can exercise their option of the contract to buy the underlying asset at the strike price.
If the underlying asset’s value moves out of favor of the buyer before expiration, they can sell the option at a lower premium for a loss or continue to hold it to see if the underlying asset’s value changes to be in their favor in time for expiration. If at expiration the value of the underlying asset is still below the strike price (this is called out of the money), the buyer can let the option contract expire worthless.
The option seller (the contract writer) can also sell the contract to another investor to close their position before expiration. At expiration, if the option is in the money, they will still be able to keep the premium but they will be assigned to buy or sell (depends on the option they wrote) the underlying asset. If the option is out of the money, their position is automatically closed and their capital is no longer at risk.
So there are three ways to close out an options trade:
- prior to expiration, you can buy or sell the contract itself to close your position (for profit or loss)
- prior to or at expiration, the buyer can exercise their option in which the seller would get assigned
- at expiration, the buyer can let the contract expire worthless
I’ll discuss closing an options trade in more detail in a future article about option contract pricing.
How to Read an Options Contract
Now that you know how option contracts work and their makeup, you can now learn to “read” an option. Here’s an example of an options contract:
SPY MARCH 15 ’20 $260 CALL
- SPY is the ticker for the underlying asset, in this case the S&P 500 ETF
- MARCH 15 ’20 is the expiration date
- $260 is the strike price
- Call is the type of option, in this case a call
Every broker is different and may display the elements of an options contract in different orders and formats, but they are all generally the same. Sometimes you will see an option in shorthand that can look confusing, but it’s all the same information, just more compact. For example, this is the same option as above but for a put instead of a call:
SPY051520P220
SPY is the ticker, 051520 is the expiration date (5/15/2020), P is the option type (in this case a put, or could be C for call), and 220 is the strike price.
Why Trade Option Contracts Instead of Stocks Directly?
With trading stocks (or any equity), you have limited leverage and flexibility. For the most part, you can only buy a stock or short a stock. With trading options, you have much more leverage and flexibility.
Let’s look first at how an option provides more leverage. A single options contract (almost) always controls 100 shares of the underlying asset. So in other words, you can control 100 shares for the price of the option’s premium without having to buy 100 shares of the stock outright. For example, SPY is currently trading at $240. You could buy 100 shares outright for $24,000 or you could buy one call option contract for a fraction of the price, which could be anywhere from, say, $400 to upwards of $1,000 depending on the strike price and expiration. Or, you can invest $24,000 to buy 40 call option contracts with a $6 premium ($600 total per contract) to instead control 4,000 shares of SPY worth $960,000. This is how options provide more leverage.
In terms of flexibility, trading stocks is one directional, up or down, and your profit and loss is directly tied 1:1 with the stock. Here is the profit and loss payoff chart for going long on a stock and shorting a stock.


When you buy a stock (a.k.a. go “long”), you profit when the stock’s price increases and incur a loss when the stock’s price decreases. When you short a stock, you profit when the stock’s price decreases and incur a loss when the stock’s price increases.
And here are the payoff charts for buying and selling a call option contract and buying and selling a put option contract.


You’ll notice immediately the differences. Each of the above option strategies either have a limit to how much loss you can incur or a limit to how much profit you can gain. Behind the scenes, they each have their own levels of risk and probability of making a profit to tolerate with these limits.
Buying and selling call or put option contracts are just scratching the surface, too. By combining different types of options with different strike prices, you can create unique option strategies to profit in any kind of market movement. Here’s some examples:


Don’t worry about these for now. Just understand that with options, you have the ability to limit both profit and loss in a single trade, profit if there is little movement in an equity, or profit if there is a lot of movement regardless if it’s up or down. This is how options provide more flexibility.
How to Read the Options Chain
Pull up a stock or ETF and you should see a link for “options.” Clicking this will take you to what’s called the options chain, which is a scary looking table full of numbers you won’t understand. But don’t worry, here’s how to read it.
Each broker will display their options chain differently, but they will all have the same essential information, and some will offer more. Here’s an example of options chain from E*Trade.

I pulled up the options chain for the symbol SPY as indicated in the top left and the type of options chain we’re looking at is the default Calls & Puts chain (don’t worry about the others for now). In the next section is some standard quote information and immediately below that is where the information for the options chain begins.
The option chains are divided into different sections by the various expiration dates shown as tabs. You’ll see I have April 9 ’20 selected. Clicking on the various expiration dates will change the data in the table beneath it.
Each row in this table is an individual options contract you can buy or sell. Splitting the table down the middle is the strike price column. By default, option chains will show a certain number of available contracts with a strike price below and above the current price of the underlying asset (again, SPY in this case). The current price of SPY at the time of this screenshot is $272 as seen in the quote section. You can change which strike prices are shown by entering a desired strike price at the top in the “Near” box.
On the left side of the strike price column in the table are call option contracts and to the right of the strike price are put option contracts. Since the current price of SPY is $272, all the call option contracts with a strike price below $272 are shaded blue because they are in the money (often abbreviated as ITM). You can see the same thing on the right side for put option contracts with strike prices above $272. Contracts that are not shaded blue are considered out of the money (OTM). When an option contract’s strike price is the same as the underlying asset’s current price (or within a few cents), it’s considered an at the money option (ATM). ITM, ATM, and OTM are the three types of option moneyness.
In the table you’ll see lots of numbers. Here’s the breakdown of each column:
- Open Interest is the total number of these contracts that are currently active and open
- Vol, short for volume, is the number of these contracts that were opened just today
- Change is today’s price (premium) movement of that contract since the closing price of the previous trading day
- Last is the price (also called the mark) of the contract’s last completed transaction, whether opened or closed
- Bid is the current maximum price buyers are willing to pay for that contract
- Ask is the current minimum price sellers are willing sell that contract for
Here’s a more advanced options chain table from Power E*Trade, their more advanced options trading platform.

Let me first point out these options chains are only looking at call option contracts - notice the strike price column is not in the middle anymore but all the way to the right. That’s because with more advanced option trading platforms, you can hide one side or the other to see more columns of information for a contract all at once.
Although these options chains look completely different on the surface, it’s still mostly the same information. Take a minute to compare this screenshot to the previous one and try to spot what’s the same and what’s new.
The first difference you might notice is I’ve selected multiple expiration dates, Apr-09-20 and Apr-15-20 and you can see both option chains displayed below at once.
Here’s a breakdown of the data in the new columns in the table.
- Bid Size is the number of contracts buyers have placed buy orders for that are waiting to be filled at the current bid price
- Ask Size is the number of contracts sellers have placed sell orders for that are waiting to be filled at the current ask price
- Delta, Gamma, Theta, and Vega (along with Rho which isn’t shown) are referred to as the Greeks and I’m going to cover this in another article - don’t worry about them for now
- Implied Volatility or IV is a measurement of how volatile the price of that contract is
- Prob ITM Exp ATM IV is the probability that contract will be ITM at it’s expiration date (this is calculated using the IV from the same expiration date contract that’s currently ATM)
- Intrinsic Value is the dollar value worth per contract if it expired right now. Only contracts ITM have an intrinsic value greater than 0
- Extrinsic Value is the dollar value worth per contract investors give an option based on its profit potential at expiration that has not yet been realized
How to Buy to Open an Option Trade
Before you can buy to open an options contract, you will need to get option approval from your brokerage. How to accomplish this is different with each broker, but should be easy to figure out. There are typically four levels of option access, with each level permitting different types of option strategies. Apply for at least level two. Your broker will tell you what each level grants access to. Once you submit your request, it may take a few trading days to be approved.
There are various ways for each broker to open a new position for an options contract, but you can most likely click a contract’s ask price to buy it or the bid price to write (sell) it. Here’s what it looks like in Power E*Trade to buy the April 15th $268 contract.

- at the very top, confirm you have the right account selected
- below that, confirm the symbol is correct, in this case SPY
- confirm whether you want to buy or write the option using the Action toggle
- select the number of contracts you want to buy under Qty
- confirm your Expiration date is correct
- confirm your Strike price is correct
- Price Type let’s you choose how you want your order executed, I recommend to always use limit to secure your desired price
- set your desired price under Limit Price. To the right, you can see the bid and ask price for the contract change in real time as you’re placing your order
- set how long you want your order to stay open under Duration
- set whether you want your order to process only if it can buy or write all the contracts at your limit price under Special Handling
After everything looks correct, clicking the Preview button will allow you to do one final confirmation of your trade before placing an order.
How to Sell to Close an Option Trade
To close an open position, go to your open positions list in your broker and find the position you want to close. There should be a close button or link when you hover over it or select it. This is the best way, at least for me, to ensure you’re closing a position, instead of selling to open a new position.
And that’s an overview of what options are, how they work, why options can be a useful instrument for investors, and how to open and close an option trade.
In the next article, I’ll cover what affects a contract’s price, dive deeper into the definitions of some of the items in this article (e.g. IV, Prob ITM, etc), and explain what each of the Greeks mean.
You might also enjoy
-
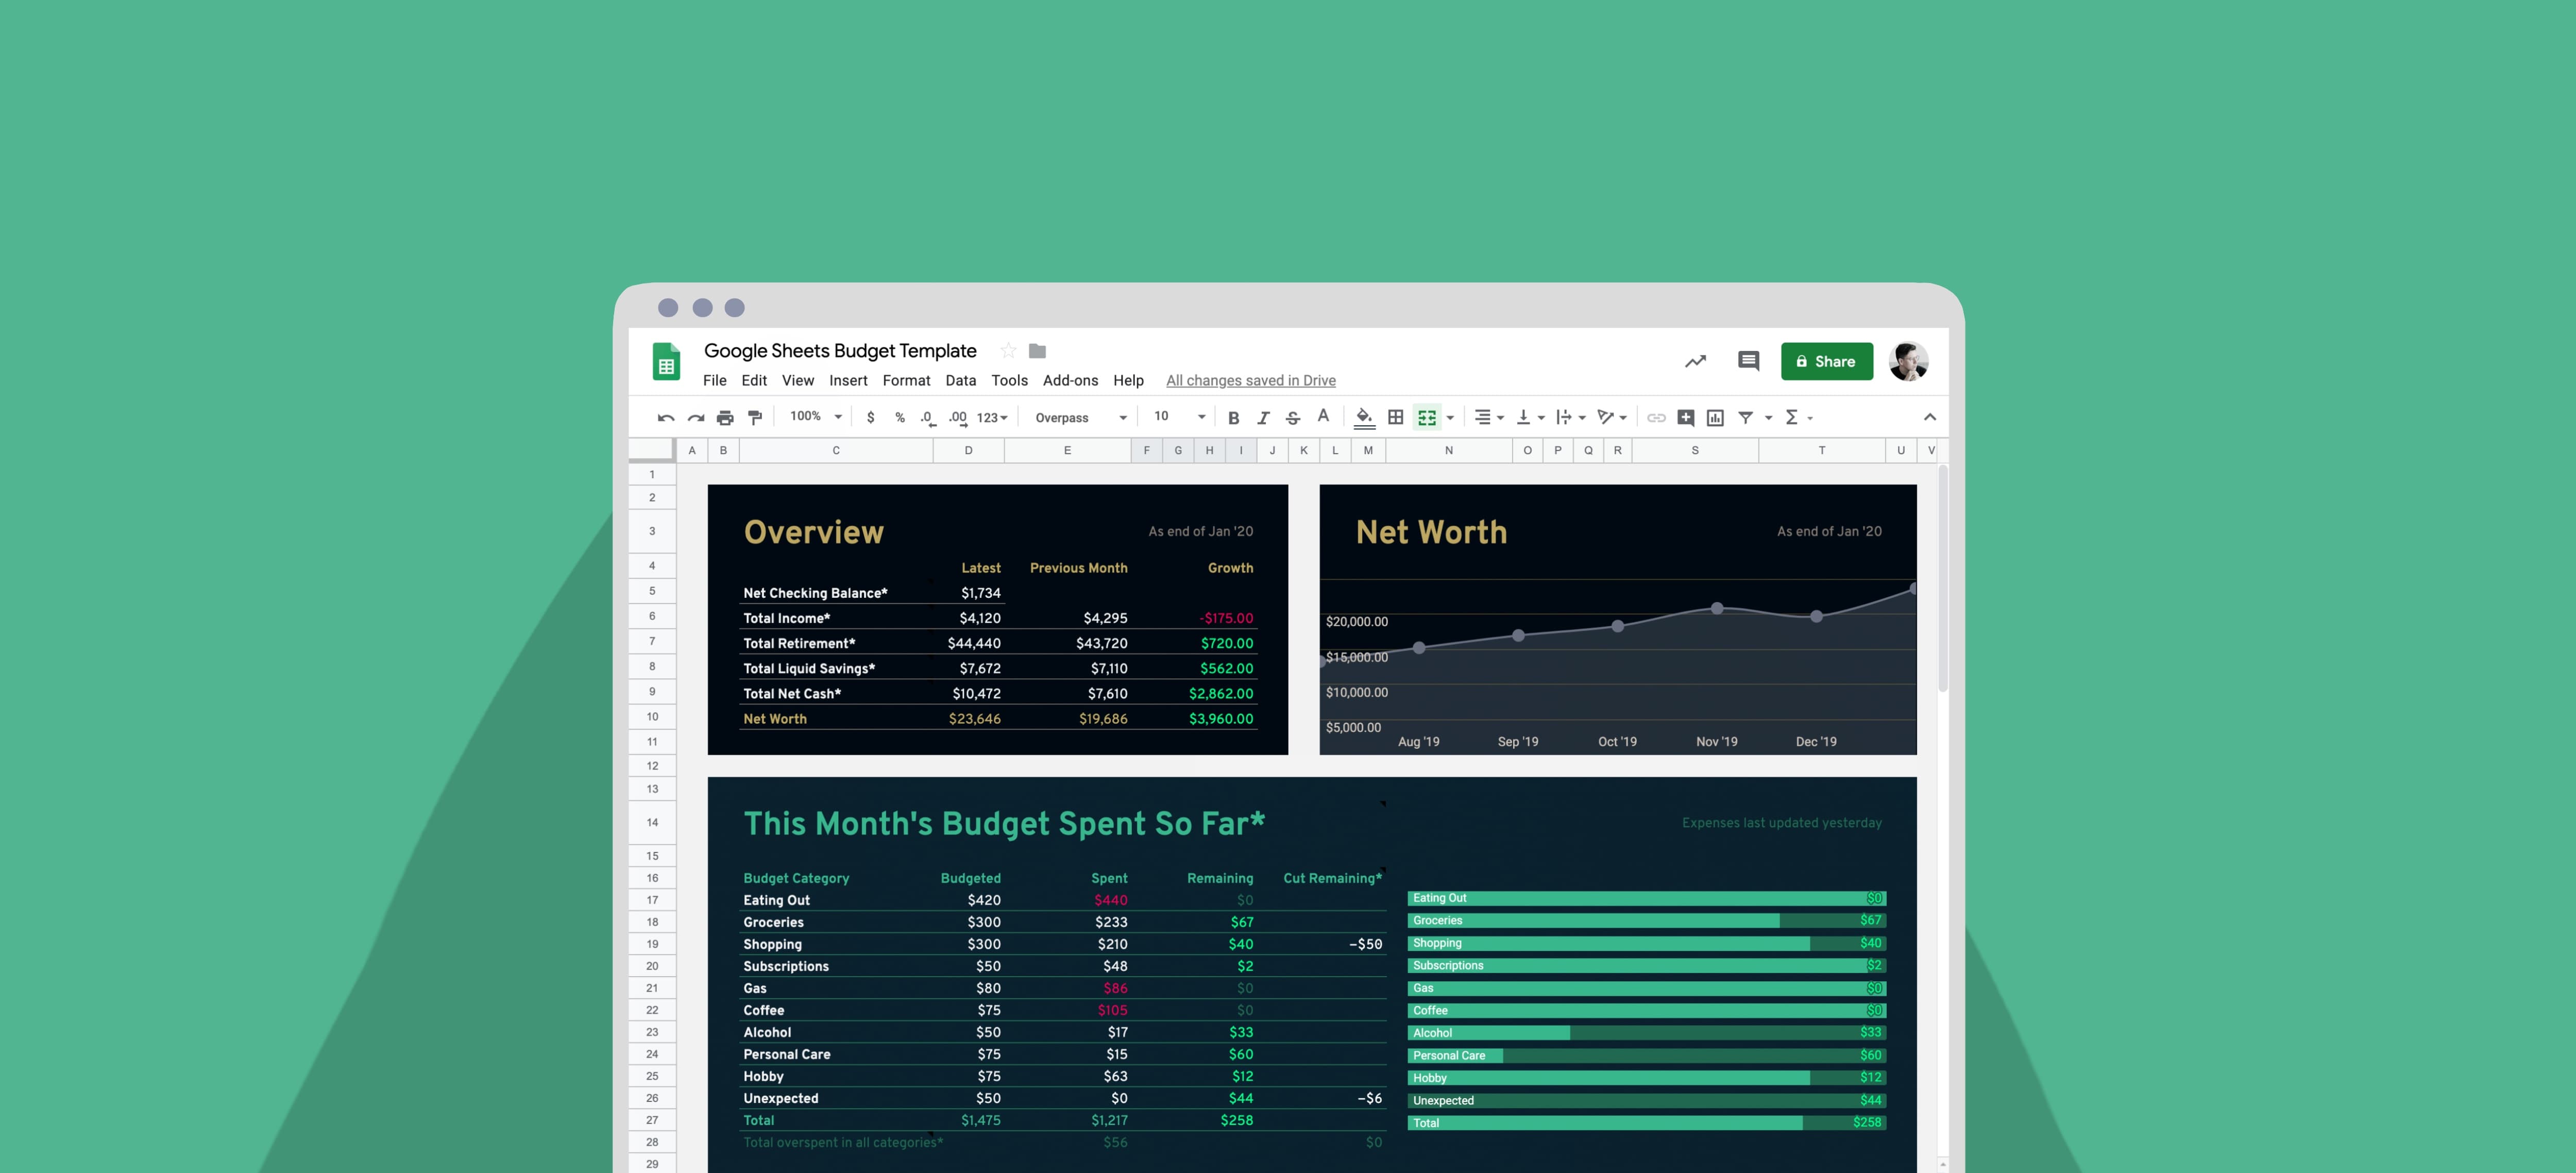
My Google Sheets Budget Template (for Millennials)
Here's the spreadsheet budget I made to make budgeting fun.
-

I Will Teach You to Be Rich—Summary, Notes, + Quotes
The best introduction to personal finance and how to enjoy spending your money.


Never Miss an Article
Get notified by email when I publish a new article.